

Find out more: https://community.oracle.com/products/oracleanalytics/categories/training
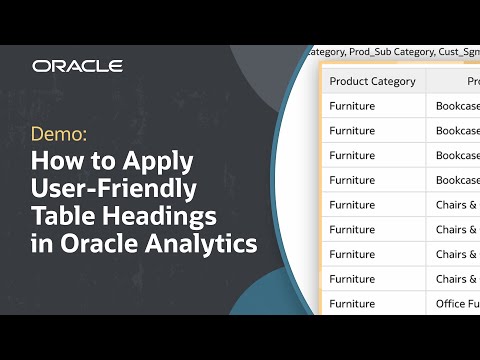
In this tutorial, we’ll learn how to configure tables and pivot charts in Oracle Analytics. Business users can quickly format headings in tables and visualizations to enhance readability. Sometimes datasets have column names with technical terminology or abbreviations. This tutorial reviews the steps to locate the Visualize tab as well as the Display Header within the Grammar Panel and update it to reflect the custom headings needed.
Like what you learned about Oracle Fusion Data Intelligence? Subscribe now https://social.ora.cl/60025k87j
Join us at Oracle CloudWorld – https://social.ora.cl/60035eVvJ
Contact FDI Sales – https://social.ora.cl/6003FLUMT
Learn More about Oracle FDI – https://social.ora.cl/6009FLU33
FDI Customer Success Stories – https://social.ora.cl/6002FLU3Q
Follow us here:
LinkedIn: https://social.ora.cl/60035eXuF
X: https://social.ora.cl/6008abVgG
Instagram: https://social.ora.cl/60095eXDN
Facebook: https://social.ora.cl/60065enQp