Explore a range of training programs in Oracle Analytics designed to boost your skills: https://social.ora.cl/60054Dc6c
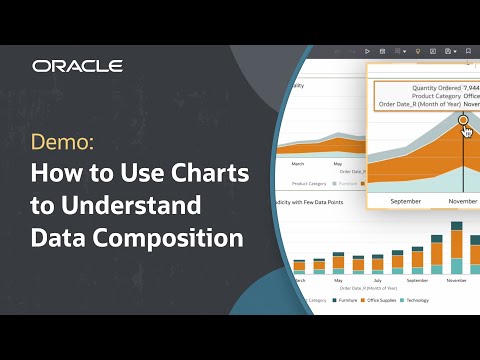
In this tutorial, we’ll learn how to create and use a Waterfall chart in Oracle Fusion Data Intelligence (FDI). A Waterfall chart is a type of bar chart that helps track the composition of a measure over time. This tutorial locates Waterfall charts in the Visualization pane in a workbook. It also shows how to add data to it by dragging relevant data onto the different axis and then visualizing the data changing over time related to a specific example.
Check out more information on bar graphs: https://social.ora.cl/60044DcBM
Like what you learned about Oracle Fusion Data Intelligence? Subscribe now https://social.ora.cl/60025k87j
Contact FDI Sales – https://social.ora.cl/6003FLUMT
Learn More about Oracle FDI – https://social.ora.cl/6009FLU33
FDI Customer Success Stories – https://social.ora.cl/6002FLU3Q
Follow us here:
LinkedIn: https://social.ora.cl/60035eXuF
X: https://social.ora.cl/6008abVgG
Instagram: https://social.ora.cl/60095eXDN
Facebook: https://social.ora.cl/60065enQp


