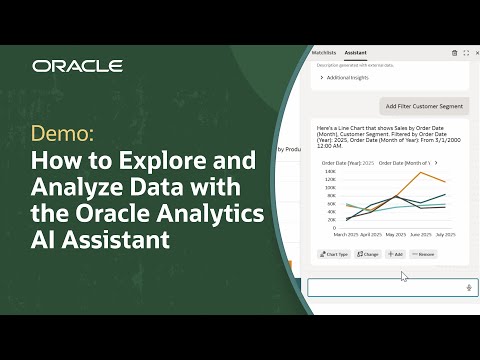
Explore a range of training programs in Oracle Analytics designed to boost your skills: https://social.ora.cl/60024Difg
In this tutorial, we’ll take on the role of workbook authors and learn how to create interactive charts in Oracle Fusion Data Intelligence (FDI). Interactive charts allow analytics consumers to toggle visualization options for faster analysis and within more organized workbooks. This tutorial reviews how to take multiple visualizations on a single canvas and turn them into a single visualization so consumers can choose the data they want to see.
Check out detailed instructions on how to bind parameters to filters: https://social.ora.cl/60024DiAo
Like what you learned about Oracle Fusion Data Intelligence? Subscribe now https://social.ora.cl/60025k87j
Contact FDI Sales – https://social.ora.cl/6003FLUMT
Learn More about Oracle FDI – https://social.ora.cl/6009FLU33
FDI Customer Success Stories – https://social.ora.cl/6002FLU3Q
Follow us here:
LinkedIn: https://social.ora.cl/60035eXuF
X: https://social.ora.cl/6008abVgG
Instagram: https://social.ora.cl/60095eXDN
Facebook: https://social.ora.cl/60065enQp


