

Explore a range of training programs in Oracle Analytics designed to boost your skills: https://social.ora.cl/6005fu0Tx
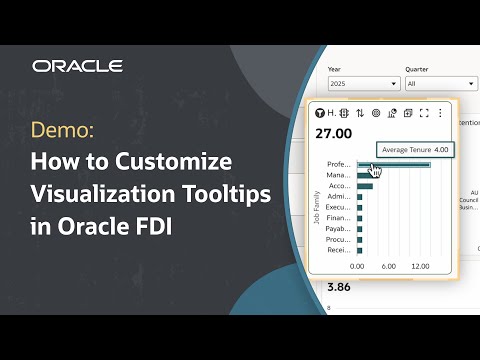
In this tutorial, we’ll learn how to use tooltips to create custom descriptions for visualizations in Oracle Fusion Data Intelligence (FDI). Customizing tooltips in visualizations enables business users to display the most relevant context—such as additional metrics or descriptions—when hovering over data points. Custom tooltips enhance clarity and provide more context without cluttering the main chart, making it easier for users to quickly interpret data.
Check out detailed instructions on modifying a visualization’s tooltips: https://social.ora.cl/6007fu0XD
Like what you learned about Oracle Fusion Data Intelligence? Subscribe now https://social.ora.cl/60025k87j
Join us at Oracle CloudWorld – https://social.ora.cl/60035eVvJ
Contact FDI Sales – https://social.ora.cl/6003FLUMT
Learn More about Oracle FDI – https://social.ora.cl/6009FLU33
FDI Customer Success Stories – https://social.ora.cl/6002FLU3Q
Follow us here:
LinkedIn: https://social.ora.cl/60035eXuF
X: https://social.ora.cl/6008abVgG
Instagram: https://social.ora.cl/60095eXDN
Facebook: https://social.ora.cl/60065enQp