

Explore a range of training programs in Oracle Analytics: https://social.ora.cl/6008FU6aQ
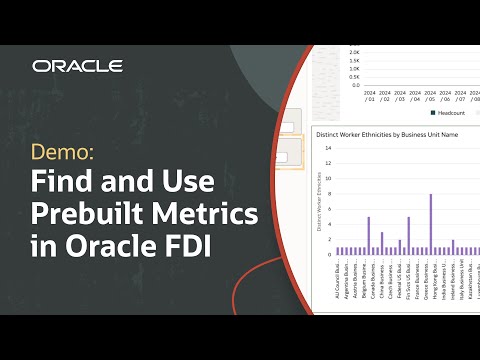
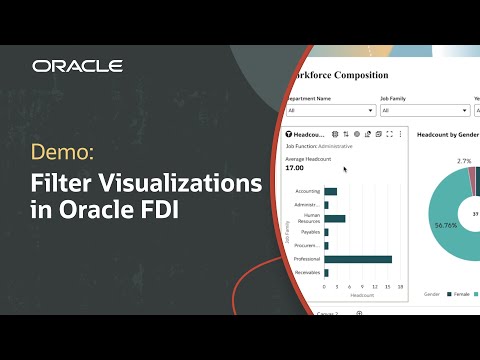
In this tutorial, we’ll explain how to filter a visualization in Oracle’s Fusion Data Intelligence. Filters affect the information presented in a workbook. Visualization filters let users amend the data shown in specific visualizations without impacting the rest of the workbook. This protects the rest of the data displayed in the workbook while still allowing users to filter for exactly what they need.
Visualizing data in Oracle Analytics server: https://social.ora.cl/6008FU6I8
Like what you learned about Oracle Fusion Data Intelligence? Subscribe now https://social.ora.cl/60025k87j
Join us at Oracle CloudWorld – https://social.ora.cl/60035eVvJ
Contact Analytics Cloud Sales – https://social.ora.cl/6005cxq9x
Learn More about Oracle Analytics Cloud – https://social.ora.cl/6007cxsiB
Analytics Cloud Customer Success Stories – https://social.ora.cl/6000cxsog
Follow us here:
LinkedIn: https://social.ora.cl/60035eXuF
X (Twitter): https://social.ora.cl/6008abVgG
Instagram: https://social.ora.cl/60095eXDN
Facebook: https://social.ora.cl/60065enQp