


Find out more: https://community.oracle.com/products/oracleanalytics/categories/training
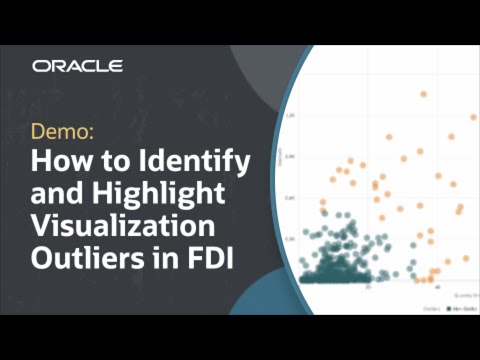
In this tutorial, we’ll identify and highlight visualization outliers in Oracle Fusion Data Intelligence (FDI). Outliers are datapoints that act differently than the rest of the data in a visualization. Highlighting these areas can uncover potential issues, opportunities, exceptions, or standout performance. This tutorial begins in a workbook with a scatterplot visualization that has potential outliers and explains how to navigate through the visualization options to highlight potential outliers. It also reviews how to take this information and apply it to many visualizations across the workbook.
Like what you learned about Oracle Fusion Data Intelligence? Subscribe now https://social.ora.cl/60025k87j
Join us at Oracle CloudWorld – https://social.ora.cl/60035eVvJ
Contact FDI Sales – https://social.ora.cl/6003FLUMT
Learn More about Oracle FDI – https://social.ora.cl/6009FLU33
FDI Customer Success Stories – https://social.ora.cl/6002FLU3Q
Follow us here:
LinkedIn: https://social.ora.cl/60035eXuF
X: https://social.ora.cl/6008abVgG
Instagram: https://social.ora.cl/60095eXDN
Facebook: https://social.ora.cl/60065enQp