

Explore a range of training programs in Oracle Analytics designed to boost your skills: https://social.ora.cl/6005fu0VP
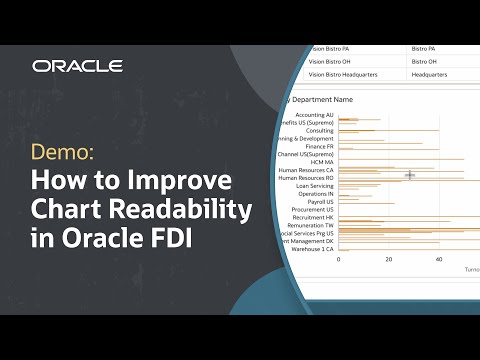
In this tutorial, we’ll learn how to sort visualizations to improve chart readability in Oracle Fusion Data Intelligence (FDI). Sorting visualization values in ascending or descending order makes it easy to spot outliers and patterns. This enables business users to identify and highlight key data points and trends faster than they would otherwise, which, in turn, speeds up analysis. This tutorial reviews the multiple ways sorting can affect the way a chart is read, like ascending, descending, alphabetical order, and filters.
Check out detailed instructions on sorting data in visualizations: https://social.ora.cl/6002fu0Zi
Check out detailed instructions on how to sort, drill, and select data in visualizations: https://social.ora.cl/6008fu0ZI
Check out detailed instructions on how to sort data in visualizations using Oracle Analytics Server: https://social.ora.cl/6004fu0wO
Like what you learned about Oracle Fusion Data Intelligence? Subscribe now https://social.ora.cl/60025k87j
Join us at Oracle CloudWorld – https://social.ora.cl/60035eVvJ
Contact FDI Sales – https://social.ora.cl/6003FLUMT
Learn More about Oracle FDI – https://social.ora.cl/6009FLU33
FDI Customer Success Stories – https://social.ora.cl/6002FLU3Q
Follow us here:
LinkedIn: https://social.ora.cl/60035eXuF
X: https://social.ora.cl/6008abVgG
Instagram: https://social.ora.cl/60095eXDN
Facebook: https://social.ora.cl/60065enQp