

Find out more: https://community.oracle.com/products/oracleanalytics/categories/training
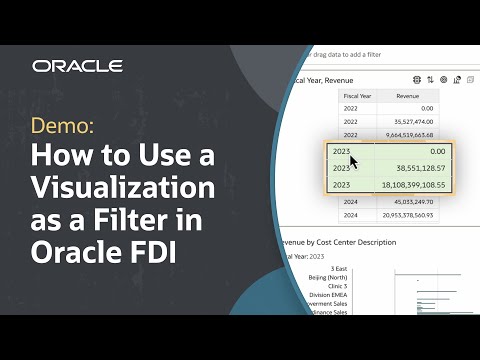
In this tutorial, we’ll learn how to use data visualizations as a filter in Oracle Fusion Data Intelligence (FDI). Using a visualization as a filter allows users to click on data points and instantly filter all related visualizations on the canvas. This makes it easier to narrow down related data without creating new filters or dashboards from scratch. This tutorial reviews the steps for locating the "Use as Filter" icon as well as how to deactivate it should it no longer be necessary.
Like what you learned about Oracle Fusion Data Intelligence? Subscribe now https://social.ora.cl/60025k87j
Join us at Oracle CloudWorld – https://social.ora.cl/60035eVvJ
Contact FDI Sales – https://social.ora.cl/6003FLUMT
Learn More about Oracle FDI – https://social.ora.cl/6009FLU33
FDI Customer Success Stories – https://social.ora.cl/6002FLU3Q
Follow us here:
LinkedIn: https://social.ora.cl/60035eXuF
X: https://social.ora.cl/6008abVgG
Instagram: https://social.ora.cl/60095eXDN
Facebook: https://social.ora.cl/60065enQp