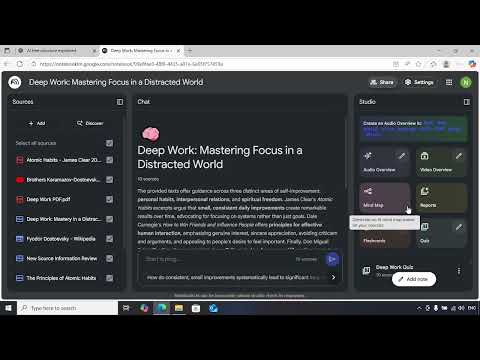


NotebookLM has introduced one of its most exciting and powerful features yet — Infographics. This update allows you to turn complex information into clean, visual summaries with just a few clicks. In this video, we break down exactly how the Infographics feature works, why it’s useful, and how you can use it to upgrade your learning, research, writing, and content creation.
The Infographics feature automatically analyzes your documents, notes, and research materials and transforms them into easy-to-understand visual diagrams. Whether you’re working with long articles, research papers, PDFs, slides, or web content, NotebookLM can now present your information in a visual format that helps you absorb ideas faster and communicate better.
With Infographics, you can generate:
Timelines for events and historical data
Flowcharts showing step-by-step ideas
Comparison charts to evaluate options
Summaries with icons and visuals
Hierarchical structures like mind maps or breakdowns
Stat-based visuals for quick understanding
Colour-coded topic trees for better clarity
This feature is incredibly helpful for:
Students who want cleaner study material
Researchers summarizing long reports
Tech professionals explaining systems and workflows
Teachers and trainers creating visual lessons
Content creators building videos, reels, and presentations
Business users who need quick visual reports
Anyone who prefers visual learning over long texts
NotebookLM’s Infographics feature saves tons of time by eliminating manual design work. Instead of creating diagrams yourself in separate tools, NotebookLM does it automatically—making your research more visual, organized, and easy to share.
In this video, you’ll learn:
What the Infographics feature does
How to generate visual summaries from your notes
Different types of infographics NotebookLM can create
How it transforms large documents into clean visuals
Tips to get better results using structured prompts
Examples of real-world use cases to boost productivity
If you want to level up your learning and present your knowledge in a more professional and visually appealing way, the new Infographics feature in NotebookLM is a complete game-changer.